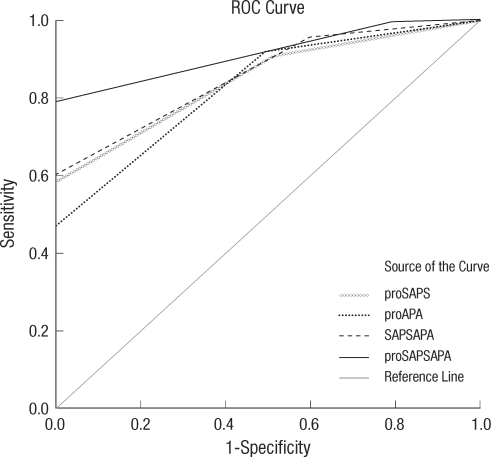
Fig. 2.
Receiver operating characteristic (ROC) curve for the prediction of infectious and non-infectious fever with the combination of PCT, SAPS II and APACHE III scores. ProSAPS, combination of PCT and SAPS II score; proAPA, combination of PCT and APACHE III score; SAPSAPA, combination of SAPS II score and APACHE III score; proSAPSAPA, combination of PCT, SAPS II score, and APACHE III score. The area under the curve was 0.849 (95% CI; 0.746-0.952) for PCT+SAPS II, 0.830 (95% CI; 0.710-0.950) for PCT+APACHE III, 0.862 (95% CI; 0.762-0.962) for SAPS II+APACHE III, and 0.917 (95% CI; 0.848-0.986) for PCT+SAPS II+APACHE III.

