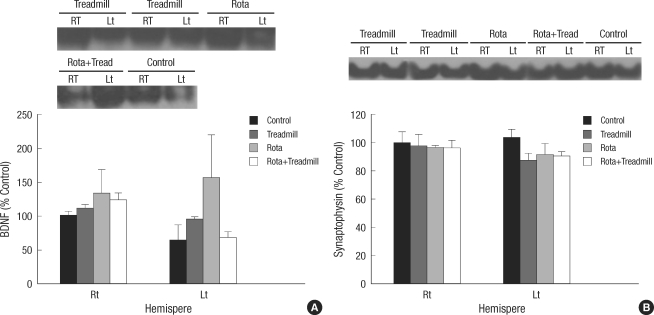
Fig. 3.
Western blot analysis. (A) Relative levels of BDNF in entire cerebral hemispheres show no significant between-group difference. A sample blot is shown; mature BDNF (about 14 kDa in size) is seen. (B) Relative levels of synaptophysin in entire cerebral hemispheres show no significant difference between groups. A sample blot is shown; synaptophysin (about 38 kDa in size) is noted.

