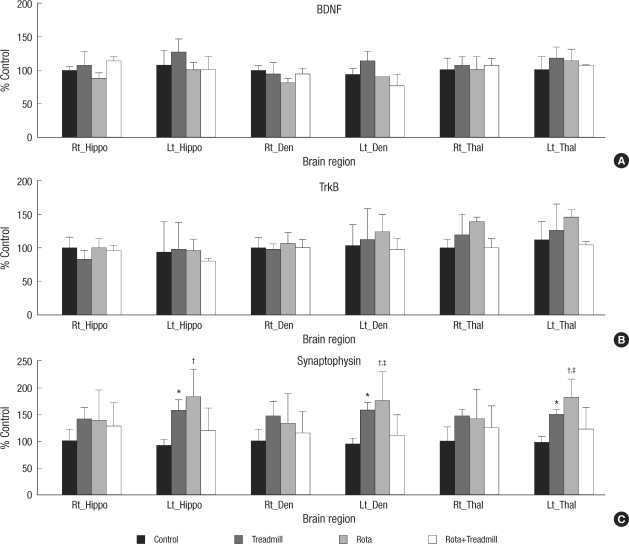
Fig. 4.
Immunohistochemical analysis. The RODs of BDNF, TrkB, and synaptophysin in each brain region are represented as percentages of each contralateral brain region of the control group. There is no significant between-group difference in the expression of (A) BDNF, or (B) TrkB by one-way ANOVA. (C) Significant differences in synaptophysin immunoreactivity are detected in the treadmill and the Rota-rod training groups as compared with the control group. Hippo, hippocampus; Den, dentate gyrus; Thal, thalamus.
*P<0.05, †P<0.01 vs no exercise control group (one-way ANOVA and Tukey's post-hoc test); ‡P<0.05 vs contralateral brain regions (paired t-test).

