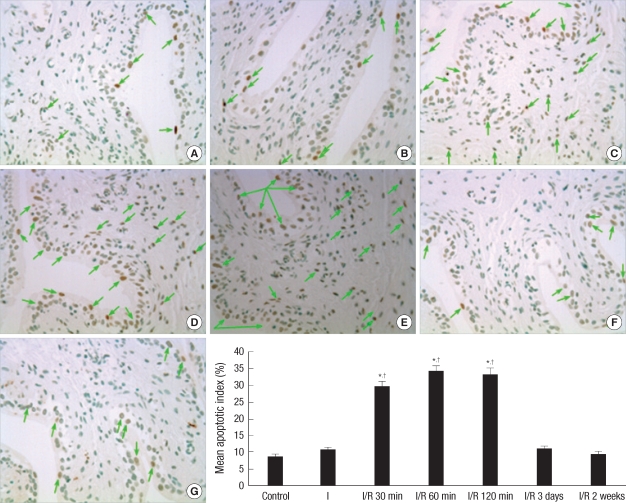
Fig. 1.
Detection of apoptosis: Representative micrographs show TUNEL positive cells as black-brown (magnification ×400), that are indicated by using arrows. Bar graphs show quantitative image analysis. The apoptotic index represents the percent of apoptotic cells within the total number of cells in a given area. *P<0.01 vs control group; †P<0.01 vs ischemia only group. (A): Control group; (B): Overdistension without reperfusion (ischemia only group, I); (C)-(G): Overdistension with reperfusion for 30 min, 60 min, 120 min, 3 days and 2 weeks, respectively (ischemia/reperfusion group, I/R).

