Figure 6.
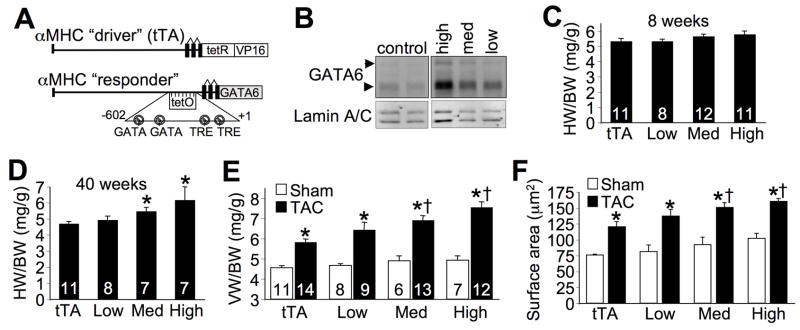
Gata6 transgenic mice develop greater cardiac hypertrophy. A, Schematic of the dual transgenic system used to generate GATA-6 transgenic lines. B, Western blot for GATA-6 and lamin A/C (loading control) from cardiac nuclear protein extracts of 8 week-old mice. Arrows indicate the long and short isoforms of GATA-6. C, Heart weight to body weight ratio (HW/BW) from 8 week-old mice of the indicated groups. D, HW/BW from 40 week-old mice. *P<0.05 vs tTA control. E, VW/BW in sham and TAC operated tTA control or the three lines to GATA-6 transgenic mice 2 weeks after TAC. *P<0.05 vs sham; †P<0.05 vs tTA TAC. F, Cardiomyocyte surface areas measured from cardiac histological sections 2 weeks after TAC. *P<0.05 vs sham; †P<0.05 vs tTA TAC. The number of animals measured is shown in the bars of the various panels.

