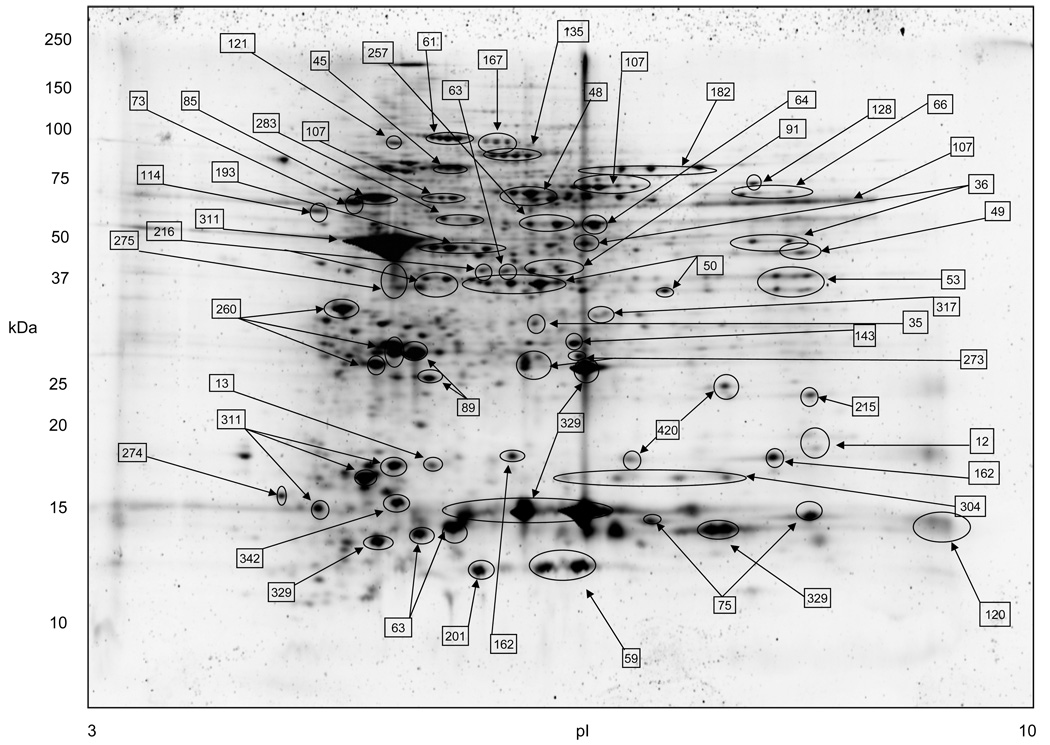
Figure 1.
The proteome map of human peripheral blood eosinophils. Isoelective focusing was conducted in the pH range 3 to 10 in the first dimension. Major protein spots indicated by arrows are identified in Table 1. Protein vertical streak was due to galectin-10 insolubility (see Discussion). 200 µg of total eosinophil cell lysate was loaded to the gel.

