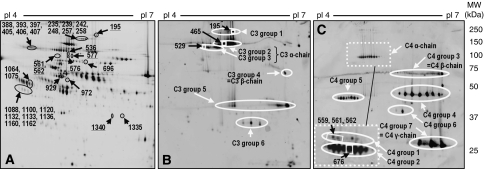
Figure 1.
Two-dimensional gel electrophoresis of the plasma proteome. (A) Position of protein spots most significantly influenced by the initial dose of the therapy on a representative 2D-gel image. Their molecular identity is indicated in Table 2. The underlined numbers represent members of the complement system. (B and C) show 2D-western blot images using antibodies against complement component C3 (B) or C4 (C). The detail displayed in the punctured frame shows the signals obtained by incubation with monoclonal anti-C4d antibody. Only this antibody recognised the upper C4 α-chain. Protein spots indicated in rectangles represent complement isoforms that are significantly differentially influenced by the initial dose between responders and non-responders.

