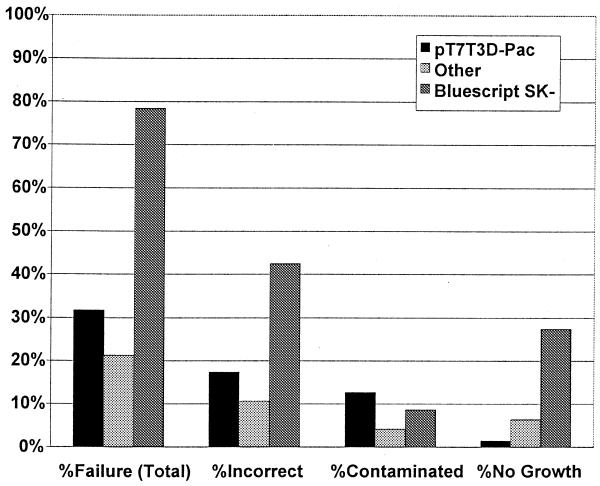
Figure 4.
Failure rate as a function of cloning vector. 1189 bacterial stock cultures were categorized based on the cloning vector used to create the cDNA library containing the desired clone. %Failure (Total) is the percentage of stocks which failed due to any reason, presented as the total number of failed stocks divided by the total number of stocks for a given vector. %Incorrect is the percentage of clones that yielded sequence data that did not match the desired clone. %Contaminated is the percentage of stocks that contained one or more distinct plasmids. %No Growth is the percentage of stocks that did not grow in culture, or those that did not yield sufficient plasmid DNA for sequencing. Data presented for the pT7T3D-Pac vector represents an analysis of 970 stocks. Data presented for ‘Other’ represents 47 stocks derived from libraries made with pBluescribe, pSPORT1, pCMV-SPORT2 or pME18S-FL3. Data presented for the pBluescript SK- vector represents an analysis of 172 stocks.

