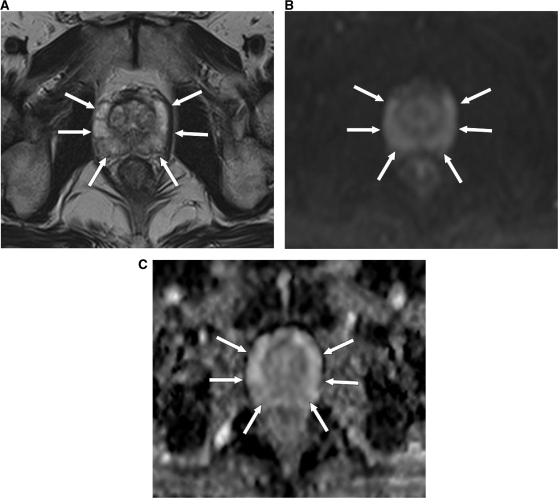
Figure 1.
MRI (at 1.5 T) of a 66-year-old male patient with a normal prostate. (A) Axial T2-weighted image shows high signal intensity in the PZ of the prostate (arrows). (B) DW-MR image at a b value of 900 s/mm2 shows high signal intensity in the PZ of the prostate, as a result of the T2 shine-through effect (arrows). (C) The PZ of the prostate returns a high ADC value, represented by colour shades of light grey (arrows).

