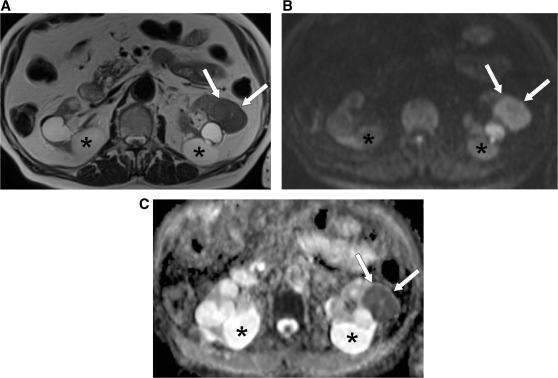
Figure 2.
MRI (at 1.5 T) of a 79-year-old patient with an RCC in the left kidney (arrows). (A) Axial T2-weighted MR image shows intermediate signal intensity of the RCC, which is comparable with that of normal parenchyma, and high signal intensity for the multiple bilateral simple cysts (asterisk). (B) DW-MR image at a b value of 900 s/mm2 shows high signal intensity of the RCC (arrows) and low signal intensity of the simple cysts (asterisk). (C) In the ADC map the RCC is clearly visualized as an area of impeded diffusion (arrows), represented by colour shades of dark grey, in contrast with the normal parenchyma of the left kidney and with the simple cysts (asterisk), which return colour shades of intermediate and light grey, respectively.

