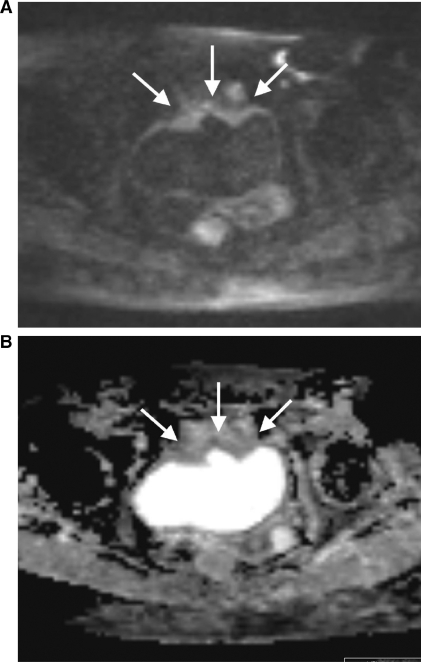
Figure 4.
MRI (at 3 T) of a 69-year-old female patient with a pT3 TCC of the bladder. (A) On the DW-MR image at a b value of 1000 s/mm2 the tumour is seen as thickening of the anterior bladder wall with high signal intensity and with irregular outer margins extending into the surrounding fat tissue (arrows). (B) On the corresponding ADC map the tumour is visualized as thickening of the bladder wall with impeded diffusion, represented by colour shades of dark grey (arrows).

