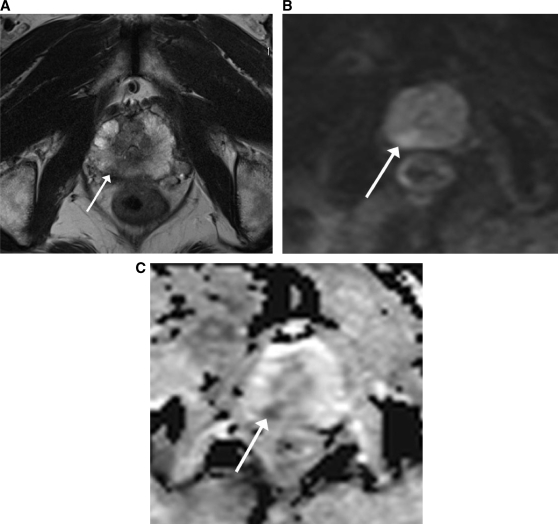
Figure 5.
MRI (at 3 T) of a 69-year-old patient with a prostate carcinoma in the PZ on the right side (arrow). (A) On the axial T2-weighted MR image the tumour is visualized as an area of low signal intensity (arrow). (B) On the DW-MR image at a b value of 1000 s/mm2 the tumour is not clearly visualized because of the T2 shine-through effect in the PZ of the prostate. (C) On the ADC map the tumour is clearly visualized as an area of impeded diffusion, represented by colour shades of dark grey, in contrast with the normal PZ of the prostate, which returns colour shades of light grey.

