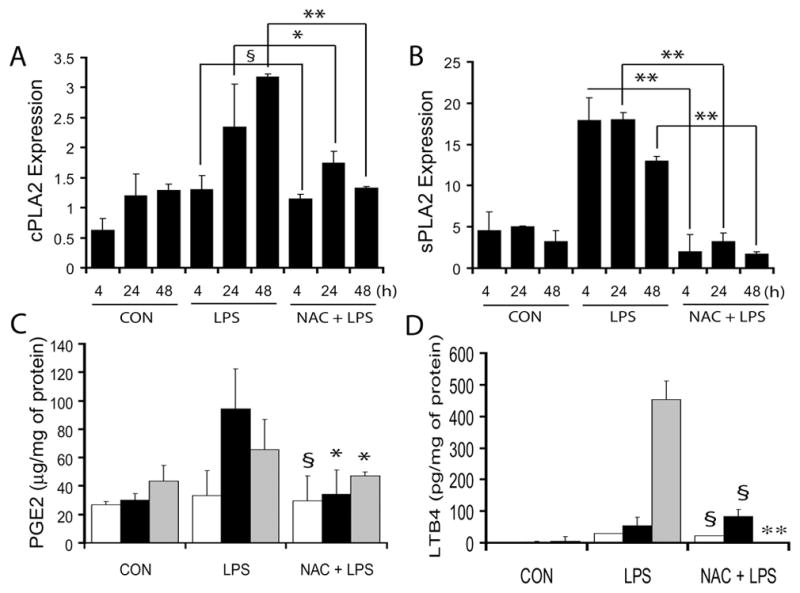
Figure 5. NAC attenuates LPS-induced phospholipids metabolism in the placenta of pregnant rats.

Plots depict cPLA2 (A) and sPLA2 (B) transcripts in the placenta of pregnant rats (n = 6) following LPS in the presence/absence of NAC. Plots depict PGE2 (C) and LTB4 (D) level in the placentas of pregnant rats at 4 h (white bar), 24 h (black bar) and 48 h (grey bar) post-LPS exposure in the presence/absence of NAC. Results in plots are expressed as Mean ± SD. Statistical significance * p<0.05, ** p<0.001 and non-significant (§), and versus LPS for C and D only.
