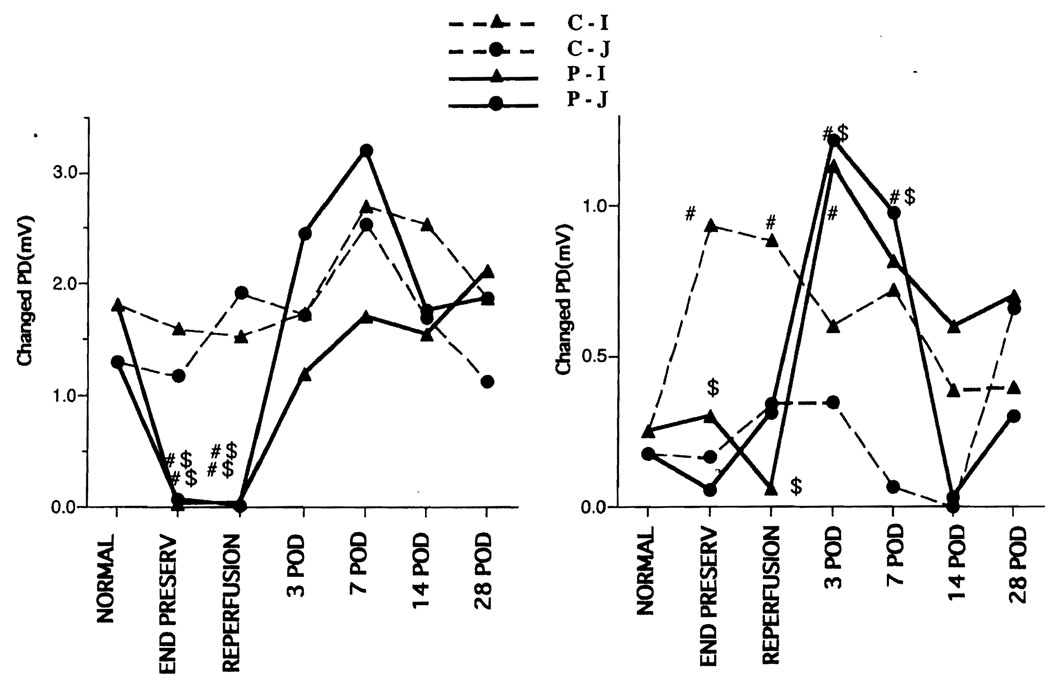
FIGURE 2.
Electrophysiology. Left: glucose-stimulated potential difference. Right: theophylline-stimulated potential difference. In the control group, the Gl-PD of the ileum and jejunum did not change, but the Gl-PD was significantly lower in the preservation group at the end of preservation and 1 hr after reperfusion, although it recovered by 3 days after the operation. In the control group, the theophylline-stimulated PD (T-PD) of the ileum was significantly increased at the end of preservation and 1 hr after preservation compared with normal; however, the T-PD of the jejunum did not increase. In the preservation group, the T-PD value was high on postoperative days (POD) 3–7. C-I, control ileum; C-J, control jejunum; P-I, preservation ileum; P-J, preservation jejunum; #, vs. normal, P<0.05; $, vs. control, P<0.05

