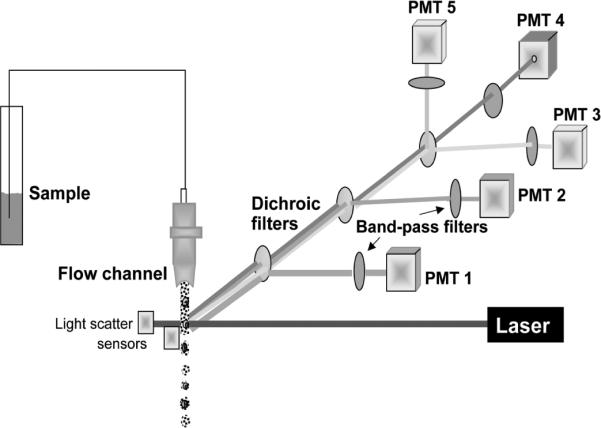
Figure 3.

Schematic representation of flow cytometry. Suspension of fluorochrome-stained cells is transported through the cytometer fluidic system in which the individual cells transect the path of laser's beam. Their emission is collected by set of dichroic optical filters which reflect light at a specific wavelength towards the photomultipliers (PMTs) and transmit light at longer wavelength. The band-pass filters located in front of PMTs allow light to pass only at a specific, relatively narrow wavelength range. Intensity of fluorescence emission at these wavelength ranges, integrated over whole cell, is measured by individual PMTs. The light scatter signal generated by the cell when it passes through the laser beam is additionally measured, often at forward and 90° angle (“side scatter”), by separate sensors. The scatter signals provide information about cell size and some morphological features. More than 1,000 cells can be measured per second with an accuracy of fluorescence measurement approaching 1% and sensitivity approaching 200 molecules of fluorescein/cell. Many models of flow cytometers have not one but two or three lasers as excitation source, emitting at UV, blue, green and/or red wavelength. This allows one to select a desired fluorochrome from variety of the available ones. A color version of this image is available at www.landesbioscience.com/curie.
