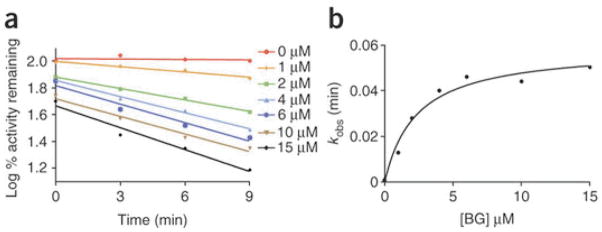
Figure 4.
Representative plots for the time- and concentration-dependent inactivation of the catalytic activity of CYP2B6 by BG. Results are averages of two trials. (a) Inactivation of the 7-EFC O-deethylation activity of CYP2B6 in the reconstituted system incubated with 0, 1, 2, 4, 6, 10 and 15 μM BG. Aliquots were removed from the primary reactions at the indicated time and assayed for 7-EFC activity. (b) From the slope of the initial linear phase of the inactivation reactions an apparent inactivation rate constant (kobs) is determined. The value of kobs is then plotted against the concentration of the inactivator to determine KI and kinact using GraphPad Prism 5.0 from GraphPad Software.

