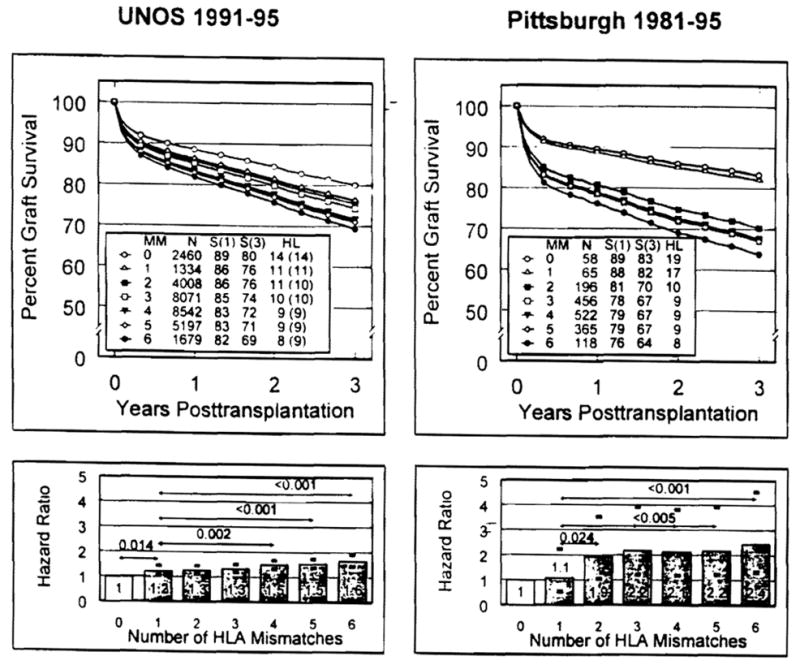
Fig. 1.

Comparisons of predicted graft survival curves (top panels) and HRs (bottom panels) by numbers of HLA -A, -B, -DR-mismatched primary cadaver renal transplantations reported to the UNOS (left panels) and University of Pittsburgh (right panels) databases. The estimates of rates of graft survival (S), half-lives (HL) beyond 1 year after transplantation, and HRs were computed for each degree of HLA mismatch (one to six antigens) after adjusting for the potential confounding effects of the regimen of immune suppression (i.e., cyclosporine vs. tacrolimus). The HL in parentheses for the UNOS cases was computed with the most widely used formula (see Patients and Methods). The differences in HRs (95% confidence limits given by darkened error bars shown in the bottom panels) between HLA groups and the one-antigen-mismatched group were significant when indicated by P-value (listed above arrow line depicting comparison).
