
Figure 2.
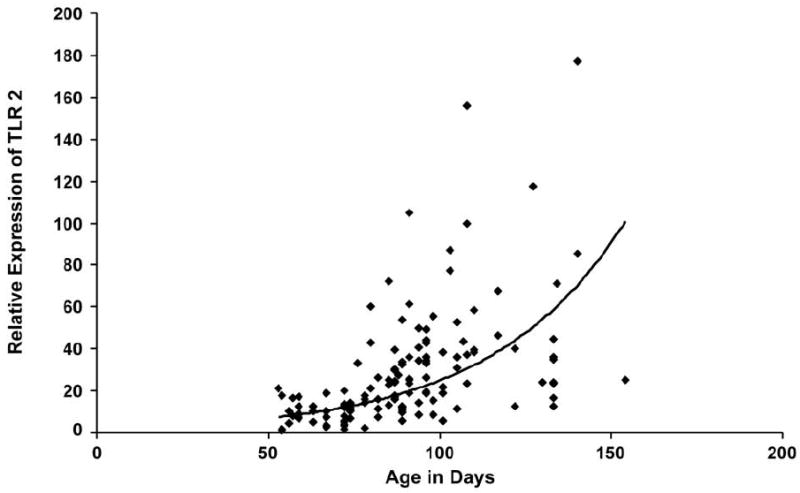
TLR2 Expression with increasing gestational age. Plot of TLR2 expression in 133 fetal lung samples versus estimated gestational age. Best fit exponential curve shown (y=1.9021e0.0258x). R2 = 0.359 and p<0.001.
Official websites use .gov
A
.gov website belongs to an official
government organization in the United States.
Secure .gov websites use HTTPS
A lock (
) or https:// means you've safely
connected to the .gov website. Share sensitive
information only on official, secure websites.
TLR2 Expression with increasing gestational age. Plot of TLR2 expression in 133 fetal lung samples versus estimated gestational age. Best fit exponential curve shown (y=1.9021e0.0258x). R2 = 0.359 and p<0.001.