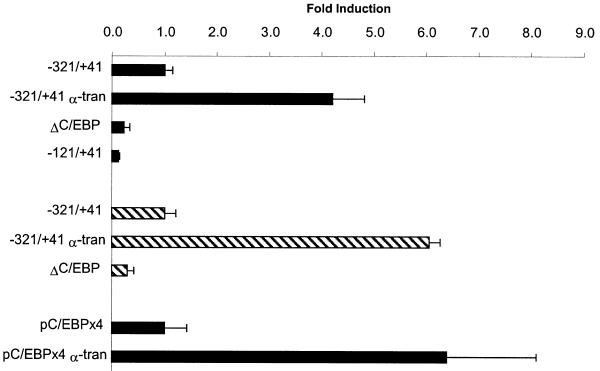
Figure 5.
Analysis of the importance of the C/EBP binding site in the minimal xC/EBPα promoter region. The –321/+41, –121/+41, ΔC/EBP and pC/EBP×4 promoter–reporter DNA constructs were transfected into Hep3B or A6 cell lines (filled and hatched histograms, respectively) in the presence of the pCS2+xα plasmid that drives the expression of xC/EBPα (α-tran) or the control parent pCS2+ vector. The control activity obtained with the –321/+41 or pC/EBP×4 DNA constructs has arbitrarily been assigned as 1, with the others being shown with respect to this value. Each value represents the mean ± SD from three independent experiments.

