
Fig. 4.
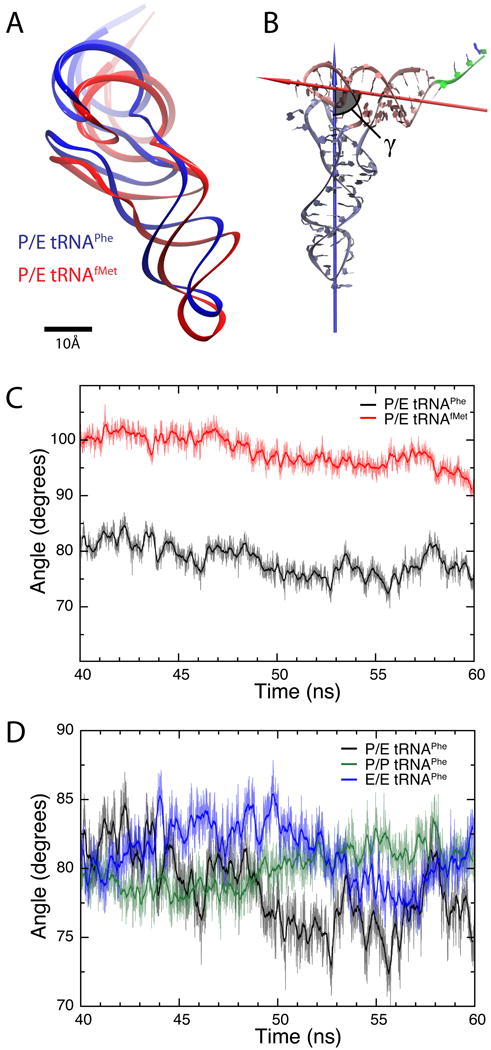
Structure of tRNAs inside the ribosome. (A) Relative position of P/E tRNAPhe (blue) and P/E tRNAfMet (red), calculated as an average from the last 20 ns of each MD simulation (all modified ribonucleosides included). (B) Definition of the angle γ formed between the two arms of the tRNA. One arm consists of the anticodon-stem loop, D loop and variable loop (ice blue), while the other is comprised of the acceptor stem and T loop (pink). The arrows show the principal axes of inertia corresponding to the smallest moments of inertia for each of the two arms. The residues in the single strand at the 3′ terminus (green) were not taken into account in the analysis. (C) Angle γ calculated for the last 20 ns for the simulation of P/E tRNAPhe (black) and P/E tRNAfMet (red). The thick lines show running averages with a 100-ps window. (D) Angle γ calculated for the last 20 ns for the simulations containing tRNAPhe in classical P/P (green) and E/E (blue) as well as hybrid P/E (black) states. The thick lines show corresponding running averages with a 100-ps window.