
Fig. 7.
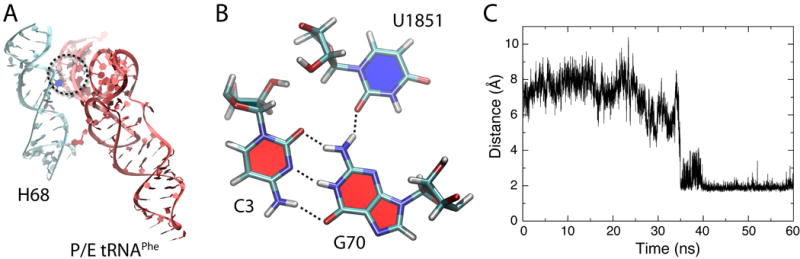
Interaction between U1851 (23S rRNA) and G70 (tRNA), observed in the fully modified P/E tRNAPhe simulation. (A) Part of helix 68 is shown, with a dashed circle highlighting the interaction with P/E tRNAPhe. (B) C3-G70-U1851 base triple is represented in detail. (C) Distance corresponding to the hydrogen bond between U1851 and G70, showing that this interaction forms after about 40 ns in the simulation containing fully modified P/E tRNAPhe and is stable thereafter.