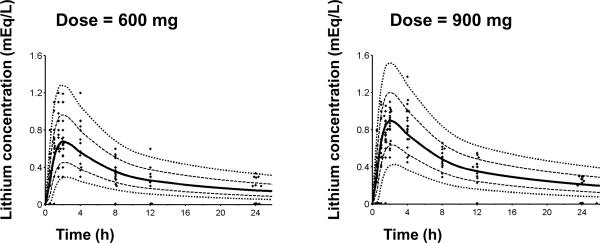
Figure 2. Visual predictive check for lithium plasma concentration versus time profiles.
The plots show the measured concentrations, the 80% prediction interval [10th – 90th percentile] and the interquartile range [25th – 75th percentile] based on the model including fat-free mass as a covariate. Lines are 10%, 25%, 50%, 75%, 90% percentiles of the predicted concentrations. The markers close to the x-axis represent concentrations below the quantification limit (BQL). At 12 and 24 h many subjects had BQL concentrations (below 0.20 or 0.25 mEq/L) which were taken into account in the model.

