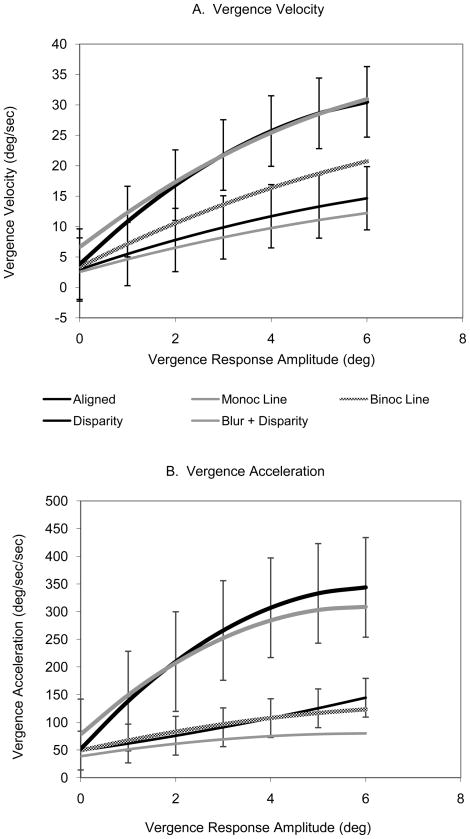
Figure 5.
A. Mean second order polynomial fits for six subjects for the three accommodative vergence trial types (Aligned, Binocular and Monocular H. Line), the disparity vergence trial (Disparity) and the trials in response to both cues (Disparity + Blur). The error bars show the standard deviation of the means between subjects for Aligned and Disparity trials. Standard errors for other conditions were similar but not shown for clarity. B. Mean vergence acceleration for six subjects. Same format as A.

