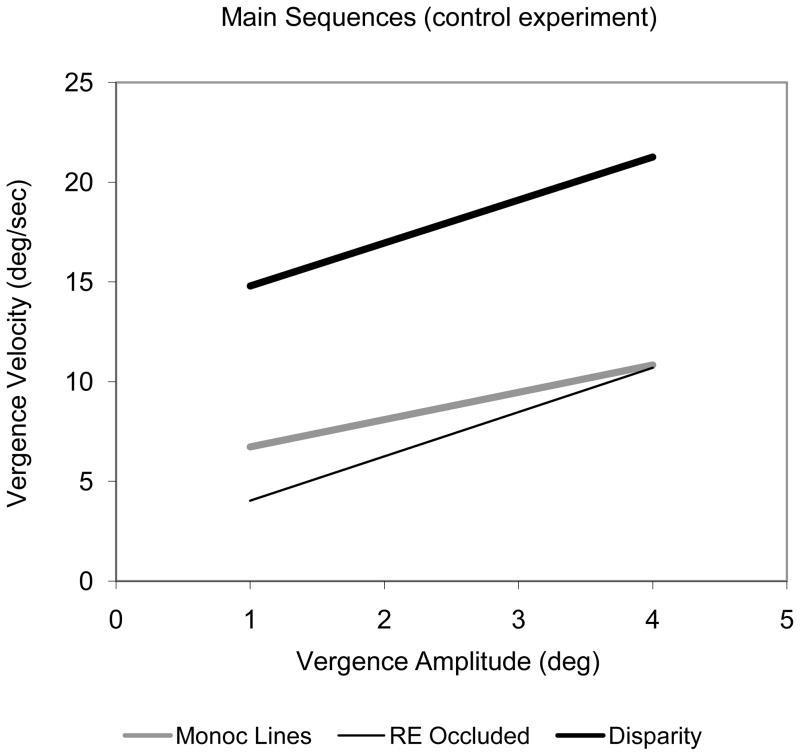
Figure 8.
Average vergence velocity for three subjects for the three conditions of the control experiment. Monocular H. Line trial (solid gray line) and Disparity trial data (solid black lines) were measured as before and Control trials (stippled line) were measured with the right eye constantly occluded.

