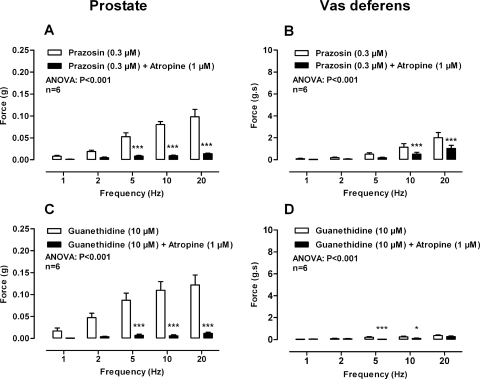
Fig. 3.
Mean contractile responses to electrical field stimulation (0.5 ms, 60 V, 1–20 Hz, 10-s pulses) in the prostate (A and C) and vas deferens (B and D) after the administration of prazosin (0.3 μM) (open bars) and prazosin (0.3 μM) plus atropine (1 μM) (solid bars) (A and B) and guanethidine (10 μM) (open bars) and guanethidine (10 μM) plus atropine (1 μM) (solid bars) (C and D). Bars represent mean force ± S.E.M. (n = 5–6). P values determined by a two-way repeated-measures of ANOVA represent the probability of the drug treatment causing a significant change. **, P < 0.01; ***, P < 0.001; solid bar versus control calculated by Bonferroni post-tests.

