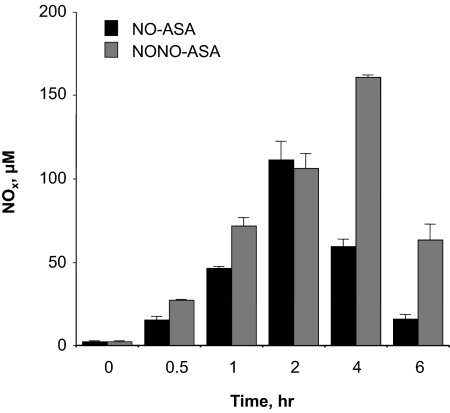
Fig. 7.
Time course of NOx levels in plasma after NO-ASA and NONO-ASA administration. Plasma concentration of NO was quantified indirectly as the concentration of NO3−/NO2− using the Griess method. Results are mean ± S.E.M. of three rats at each time point, P < 0.01 versus zero time at all time points.

