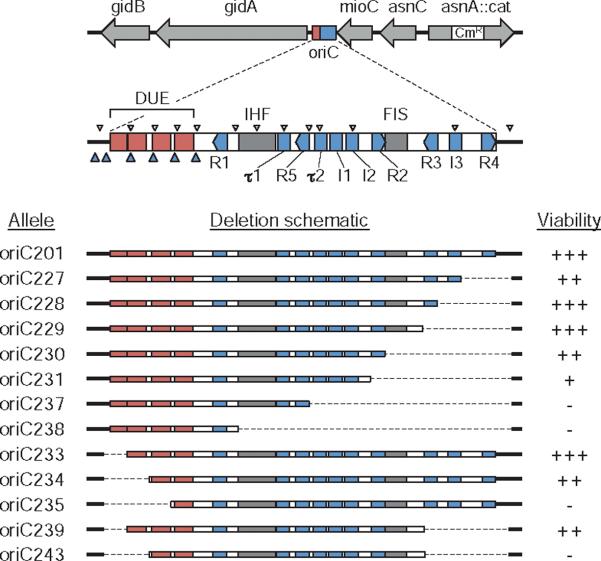
Fig. 1.
oriC deletion mutations. The oriC region with regulatory elements is shown drawn to scale. The position of the 10 9-mer DnaA binding sites R1–R5, I1–I3 and τ1–τ2 (blue rectangles); DNA unwinding elements AT-cluster and 13-mer repeats L, M and R (red rectangles); binding sites for IHF and FIS proteins (grey rectangles); putative 6-mer DnaA binding sites (small blue arrowheads); and GATC sequences (small white arrowheads) are indicated. The 12 oriC deletion alleles used in this study are shown (bottom). Right-end deletions (oriC227–oriC238) and left-end deletions (oriC233–oriC235) were generated by PCR mutagenesis (dashed lines indicate deleted regions). oriC239 and oriC243 were created by combining right- and left-end deletions. Growth rate of strains containing the mutant oriCs is indicated as viability (+++, fastest; –, non-viable).

