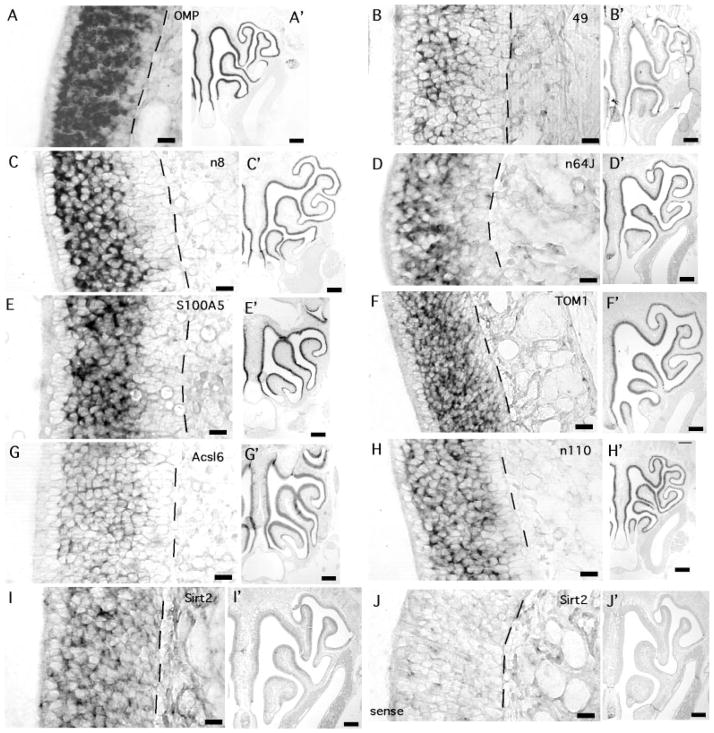
Fig. 3.
Examples of ISH for nine of the transcripts detected only in OSNs. Each panel includes a high-magnification image at left and a low-magnification image at right displaying at least half the bilaterally symmetric nasal cavity. A,A′: OMP, olfactory marker protein. B,B′: Clone 49, no known function. C,C′: Clone n8, no known function. D,D′: Clone n64J, no known function. E,E′: S100A5, a calcium binding protein. F,F′: Tom1, target of Myb-1. G,G′: Acls6, fatty acid-coenzyme A ligase, long chain 6. H,H′: Clone n110, no known function. I,I′: Sirtuin 2, a protein deacetylase. J,J′: Sense probe for sirtuin 2. Sense controls for all transcripts were tested and were as devoid of labeling as this example. Dashed lines mark the location of the basement membrane. Apical is to the left in all high-magnification panels. Scale bars = 20 μm in A–J; 250 μm in A′–J′.

