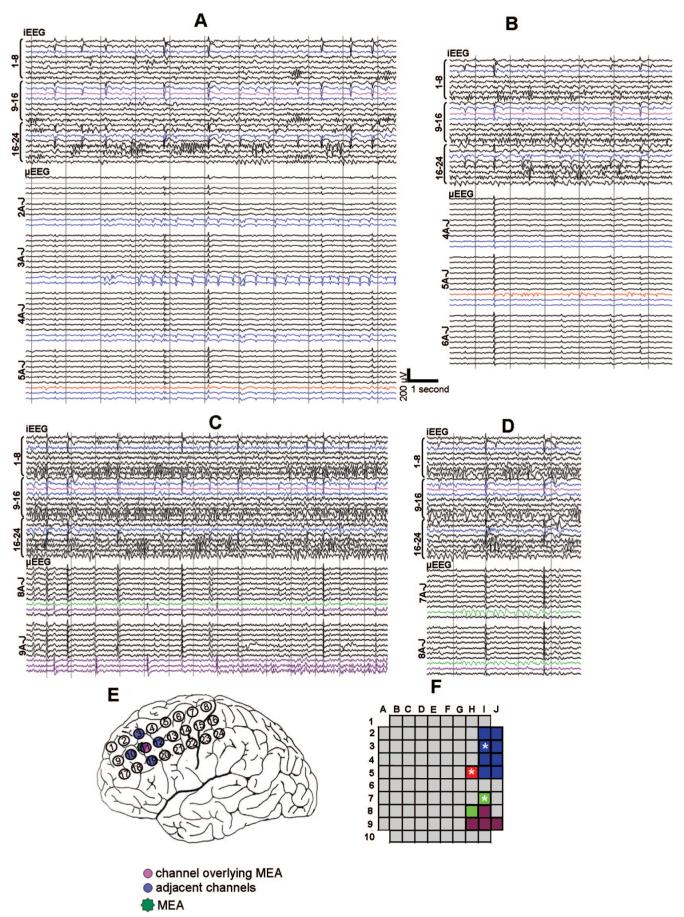
FIGURE 1.
Examples of interictal microseizure activity. μEEG is shown illustrating four morphologically and topographically distinct microseizures (panels A—D) recorded from patient 2, shown along with synchronized iEEG. Intracranial EEG electrode locations are illustrated on the implant schematic (panel E). In panels A—E, iEEG electrode 11, partially overlying the MEA, is shown in pink; the surrounding iEEG electrodes are highlighted in blue. μEEG channels are organized by rows and columns as shown in the MEA schematic (panel F). μEEG channels containing microseizures are color-coded blue, red, green and purple corresponding to distinct regions of the MEA (panel F). Microelectrode locations marked by asterisks in panel F designate channels studied in the line length calculations of Figure 4. Note that each microseizure is localized to a distinct domain and none has an iEEG correlate. Conversely, iEEG discharges seen in the lateral frontal grid appear throughout the MEA as high amplitude, widely distributed μEEG discharges with a consistent morphology.

