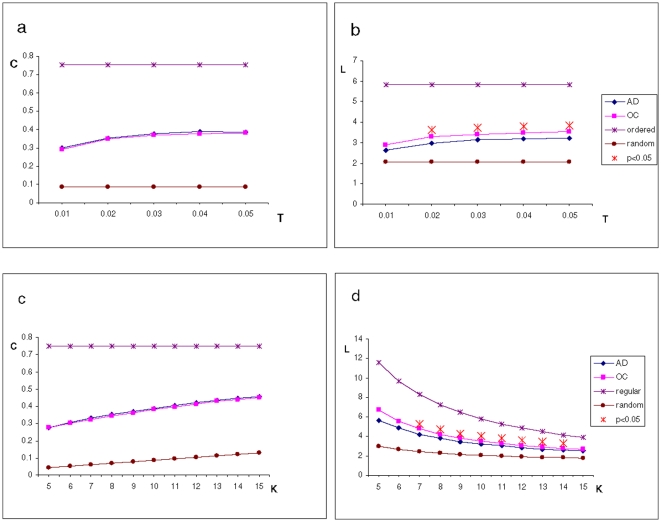
Figure 3. Cluster coefficient and path length.
Subplots (a) and (b): Mean cluster coefficient and path length calculated for a range of synchronization threshold values (0.05<T<0.01; K constant = 10). Subplots (c) and (d): cluster coefficient and path length computed for a range of K values (5<K<15; T constant = 0.05). Path length L is significantly shorter in AD within a wide range of T and K values, therefore closer to the characteristics values for random networks. Cluster coefficient C is equal for both groups.

