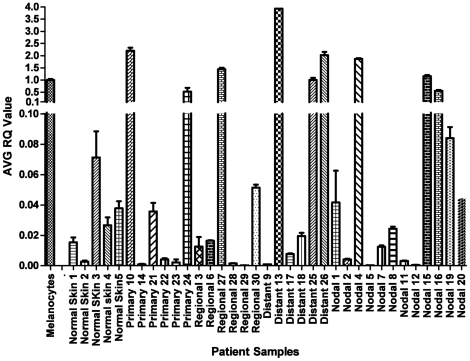
Figure 3. miR-211 expression in clinical melanoma samples.
Histograms show normalized ratios of miR-211 levels in clinical samples relative to its level in the melanocyte cell line HEM-l (normalized to 1.0), as determined by real time quantitative RT-PCR analysis. Normal skin shows low levels of miR-211 because melanocytes constitute a small fraction of normal skin cells (see text). By two-tailed t-test, the mean RQ of miR-211 in the four groups (primary melanoma, regional, distant, and nodal metastatic melanoma) compared to the mean RQ of miR-211 in HEM-l were all statistically significant at P<10−6. MC = Melanocytes, NS = Normal Skin, PM = Primary Melanoma, RM = Regional Metastases, DM = Distant Metastases, and NM = Nodal Metastases.

