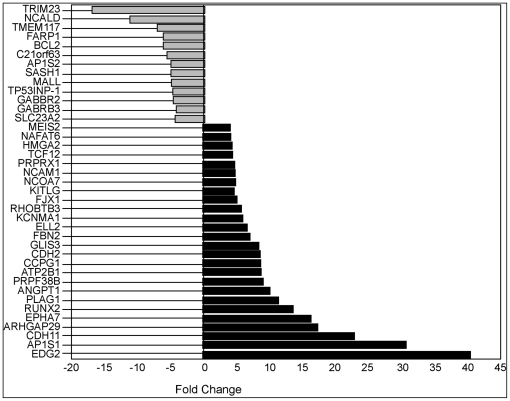
Figure 4. Expression of predicted target genes of miR-211 in WM1552C.
Histograms of log2 transformed mean expression ratios (fold change) of mRNAs in WM1552C to those in the melanocyte line HEM-l are plotted. The computationally predicted target genes were selected according to criteria described in Methods. Only genes with statistically significant fold change in expression were plotted.

