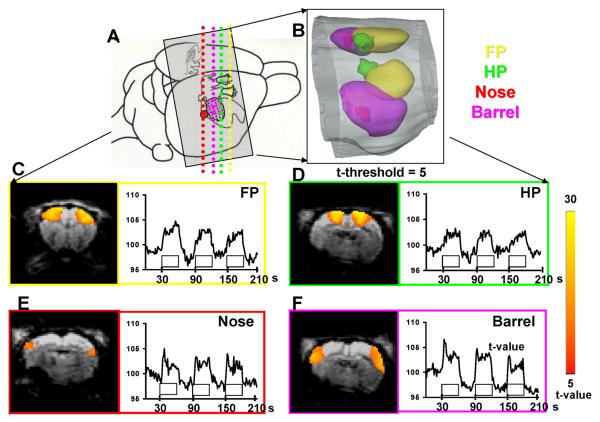
Figure 1. Somatotopic functional maps in the rat S1 cortex.
Activated S1 areas after electrical stimulation of forepaw (FP, yellow), hindpaw (HP, green), whisker pad (Barrel, purple), and nose (Nose, red) are represented in 3D contour (B) and 2D coronal t-maps (C-F). The established S1 somatotopic map (A) matches 3D functional contours of the four body parts (B). Four 2D slices were selected across the four S1 subdivisions (A). Coronal 2D t maps (C-F, left panel) are shown with the time course of BOLD signal changes (C-F, right panel) in each S1 subdivision. The BOLD signal was normalized to baseline as 100.

