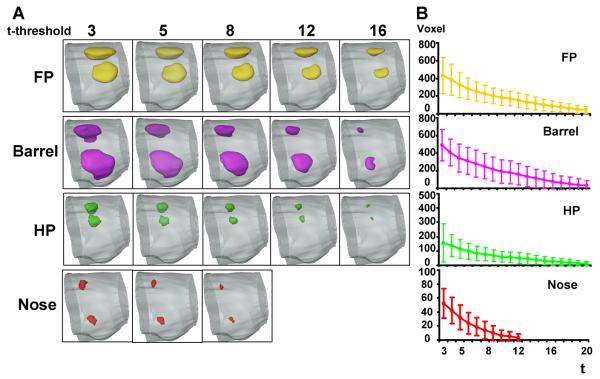
Figure 2. T-threshold dependent spatial patterns of S1 functional maps.
The 3D contour of S1 representations of forepaw (FP, yellow), whisker pad (Barrel, purple), hindpaw (HP, green), and nose (Nose, red) are displayed at different t-threshold (a). The active voxel number is displayed as a function of t-threshold (b). The error bar demonstrates the standard deviation (SD) of active voxel numbers counted from all six rats.

