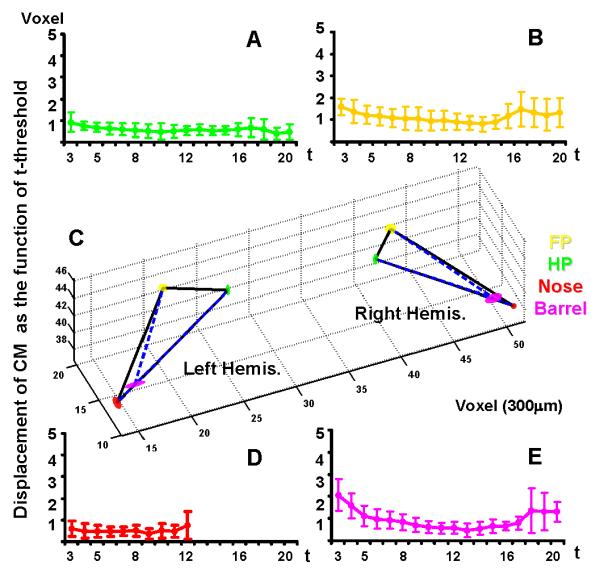
Figure 3. Localization of CMs in the 3D S1 somatotopic map.

CMs of forepaw (FP, yellow), hindpaw (HP, green), whisker pad (Barrel, purple) and nose (Nose, red) S1 areas are shown at different t thresholds. The displacement from the CM determined at a given t-threshold to the mean CM is shown as a function of t-threshold (A, B, D, and E). Four CMs at both hemispheres are shown in 3D space with a transparent ellipsoid superimposed on each center, of which the three radii demonstrated the variability of the CM coordinates in x, y, and z axes (C).
