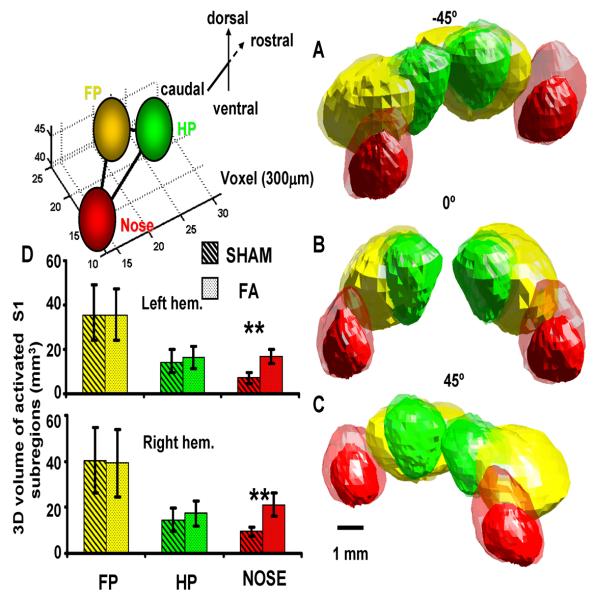
Figure 6. 3D volumetric estimation of the spatial pattern of BOLD response.
The averaged 3D volumetric surface was displayed in 3D space to represent the S1 areas of forepaw (FP, yellow), hindpaw (HP, green), and nose (red) for both hemispheres (Sham, in solid color; F.A., in semi-transparent color). The left inset demonstrates the relative 3D location of the 3D volumetric contour. The superimposed 3D volumetric surfaces are displayed through a projection view at three angles (A-C; −45, 0, and 45 ). The quantitative results show a significantly larger 3D volume of the activated nose S1 representation of the FA rats than that of the SHAM rats (D; Student's t test: left, ** means p=0.0001; right **means p=0.0002).

