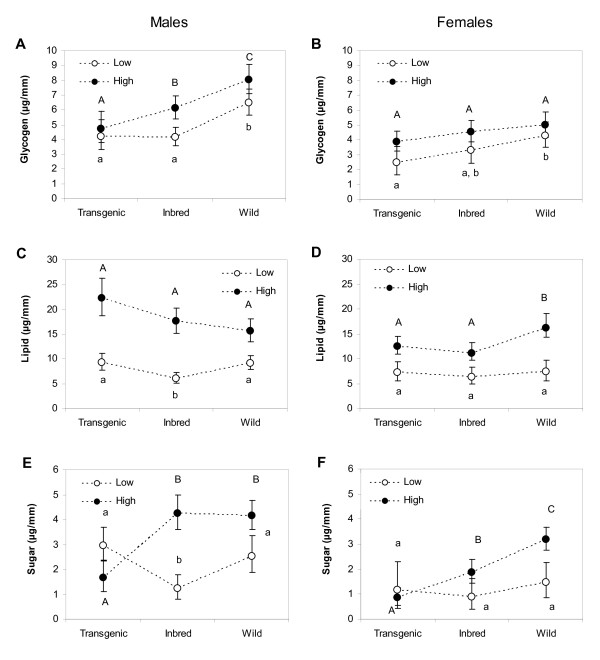
Figure 5.
Average glycogen, lipid and sugar content (μg/mm) of male and female Ae. aegypti. Values shown within panels A-F are of the Transgenic, Inbred and Wild strain. Error bars represent 95% confidence limits. Open circles denote the nutritional content at the low diet; closed circles denote nutritional content at the high diet. Averages within a diet level associated with the same letter are not significantly different (LSD post-hoc test, P < 0.05).

