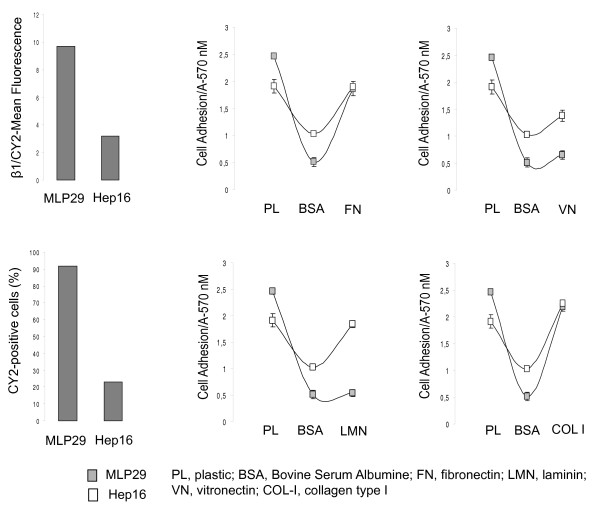
Figure 1.
Β1-integrin expression and adhesive properties of MLP29 and Hep16 cells. (A) Quantitative analysis by flow cytometry revealed that most (90%) of cells were positive for β1 staining and that the intensity levels (Geo Mean fluorescence) of β1 expression was higher in MLP29 than in Hep16 cells. The experiment was performed three times with similar results. (B) MTT assay was used to assess MLP29 and Hep16 cell adhesion capacity to different components of the extracellular matrix, including FN, VN, LMN and COL I. To prevent nonspecific cell adhesion, plates were blocked with BSA. Cell adhesion to the different substrates was estimated by measuring the optic density at A570 nm. The data presented summarize the mean (±SD) of three independent experiments, each performed in triplicate.

