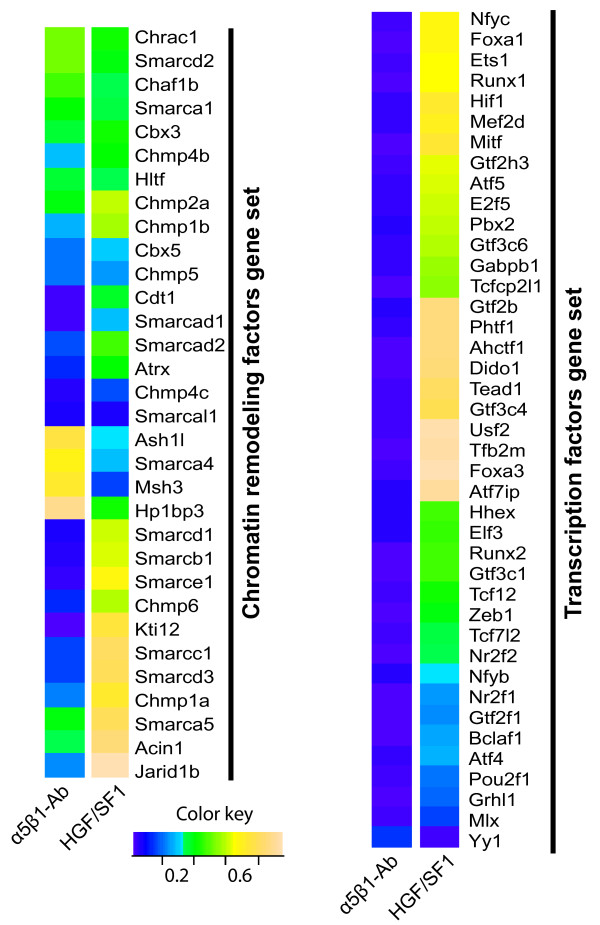
Figure 5.
Changes in the expression level of genes encoding chromatin remodeling and transcription factors in MLP29 cells during migration. (A) Changes in the expression level of genes encoding chromatin remodeling factors were plotted according to their level of significance as a color-encoded map, in which a p-value close to 1 indicates significant up-regulation, and a p-value close to 0 indicates a significant down-regulation. (B) Changes in the expression level of transcription factors following the treatment with α5β1 integrin blocking antibody or with HGF/SF1 for 24 hours.

