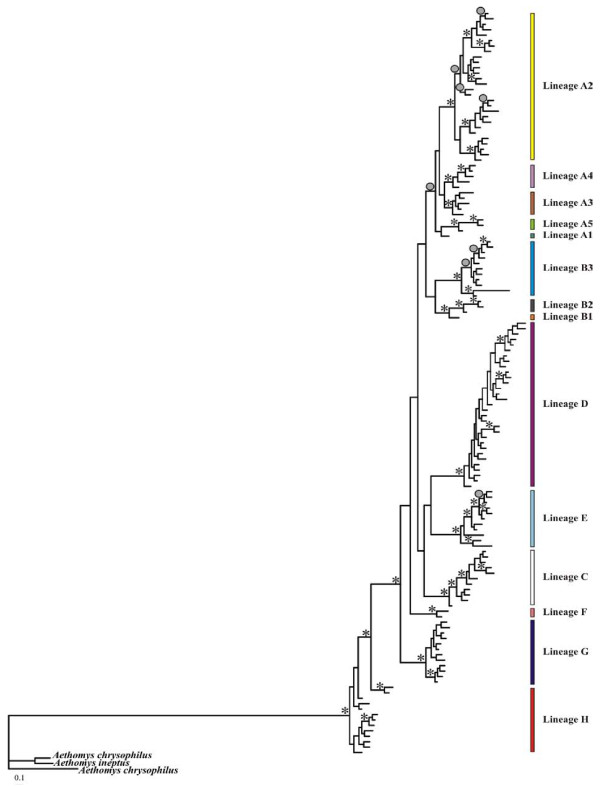
Figure 2.
A Bayesian inference (BI) tree based on 631 bp of the mitochondrial DNA (mtDNA) cytochrome b (cyt b) gene of Micaelamys namaquensis from southern Africa. The BI posterior probability values for internal branches are given at each node with either an asterisk (*) or a circle (•). Asterisks indicate BI posterior probability values ≥ 0.95 and circles indicate BI posterior probability values ≥ 0.90. Aethomys chrysophilus and A. ineptus were used as outgroups. Lineages A - H mainly correspond to different biomes or bioregions of southern Africa (Figures 1 and 5; see text for some minor exceptions). Colours correspond to those in Figures 3, 4 and 5.

