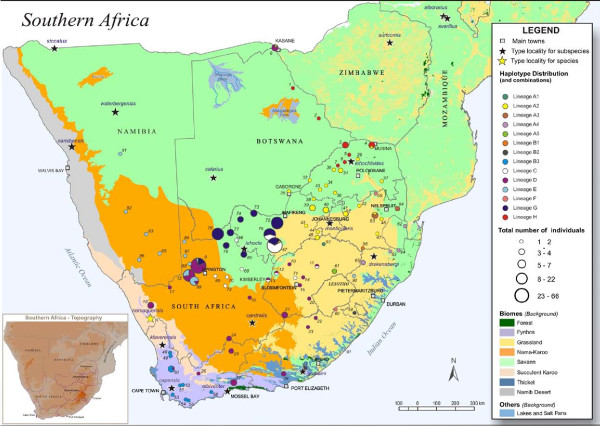
Figure 5.
Geographic distribution of Micaelamys namaquensis mitochondrial DNA (mtDNA) cytochrome b (cyt b) lineages in the biomes of southern Africa (see legend for colours). The circles indicate the number of individuals sampled at each locality (see legend for scale); the size of the pie charts represents allele frequencies. Stars indicate the type localities of the species/subspecies. The inset shows a topographical map of southern Africa. Colours correspond to those in Figures 2, 3 and 4.

