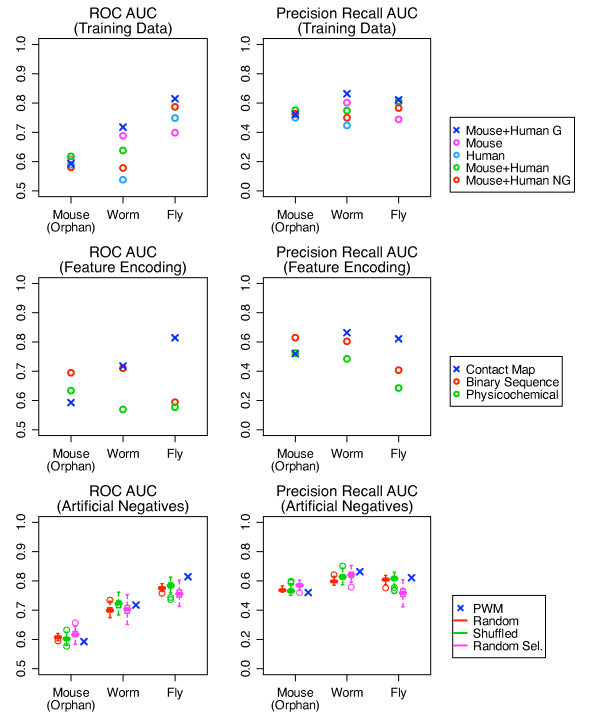
Figure 3.
Comparison of independent genomic test performance of different SVMs. Blue × denotes data or method used by our SVM in all panels. (Top Row) A comparison of SVMs trained using data from one experiment: mouse from Chen et al. (magenta) or human from Tonikian et al. (light blue), from two experiments: mouse and human (green) and from two experiments with data enriched in genomic-like or non genomic-like human data: mouse and genomic-like human (blue) and mouse and non genomic-like human (red). (Middle Row) A comparison of SVMs trained using data encoded using different feature encodings: binary sequences (red), physicochemical properties (green), contact map (blue). (Bottom Row) A comparison of SVMs trained using different methods for generating artificial negatives for phage display: random peptides (red), shuffled peptides (green), randomly selected peptides (magenta), PWM selected peptides (blue). One hundred different SVMs trained using different random, shuffled and randomly selected peptides were built.

