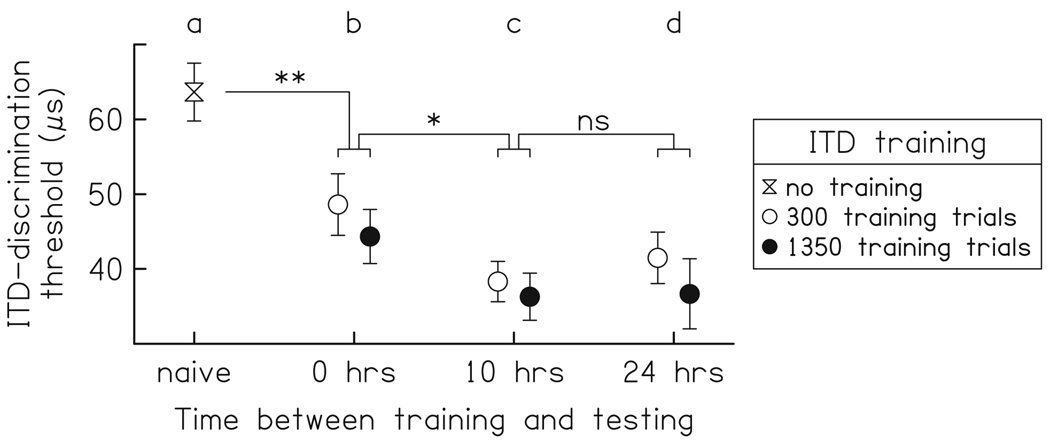
Fig. 2.
ITD thresholds of naïve and ITD-trained listeners. Mean thresholds on the target ITD condition are presented for naïve listeners (a, hourglass) and for ITD-trained listeners tested at one of three times after training: 0 h (b), 10 h (c) or 24 h (d) (Ortiz and Wright 2009). ITD-trained listeners practiced for either 300 trials (open circles) or 1,350 trials (filled circles). Error bars SEM. *P ≤ 0.05, ** P ≤ 0.01

