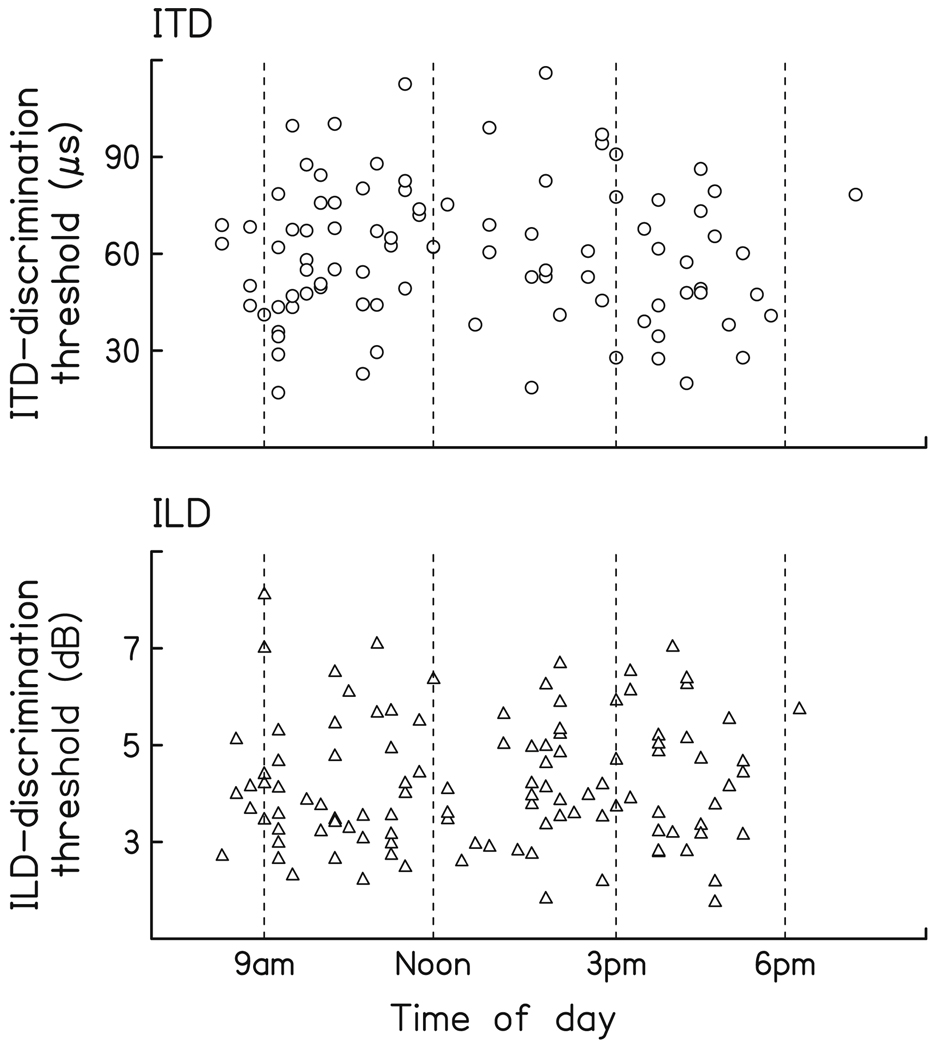
Fig. 5.
Mean values of the first five thresholds of each listener as a function of time of day. Mean values of the first five thresholds of each individual listener on either ITD discrimination (top circles naïve and ITD-trained listeners, n = 91) or ILD discrimination (bottom triangles ILD-trained listeners, n = 111) are presented as a function of the time of day these thresholds were obtained

