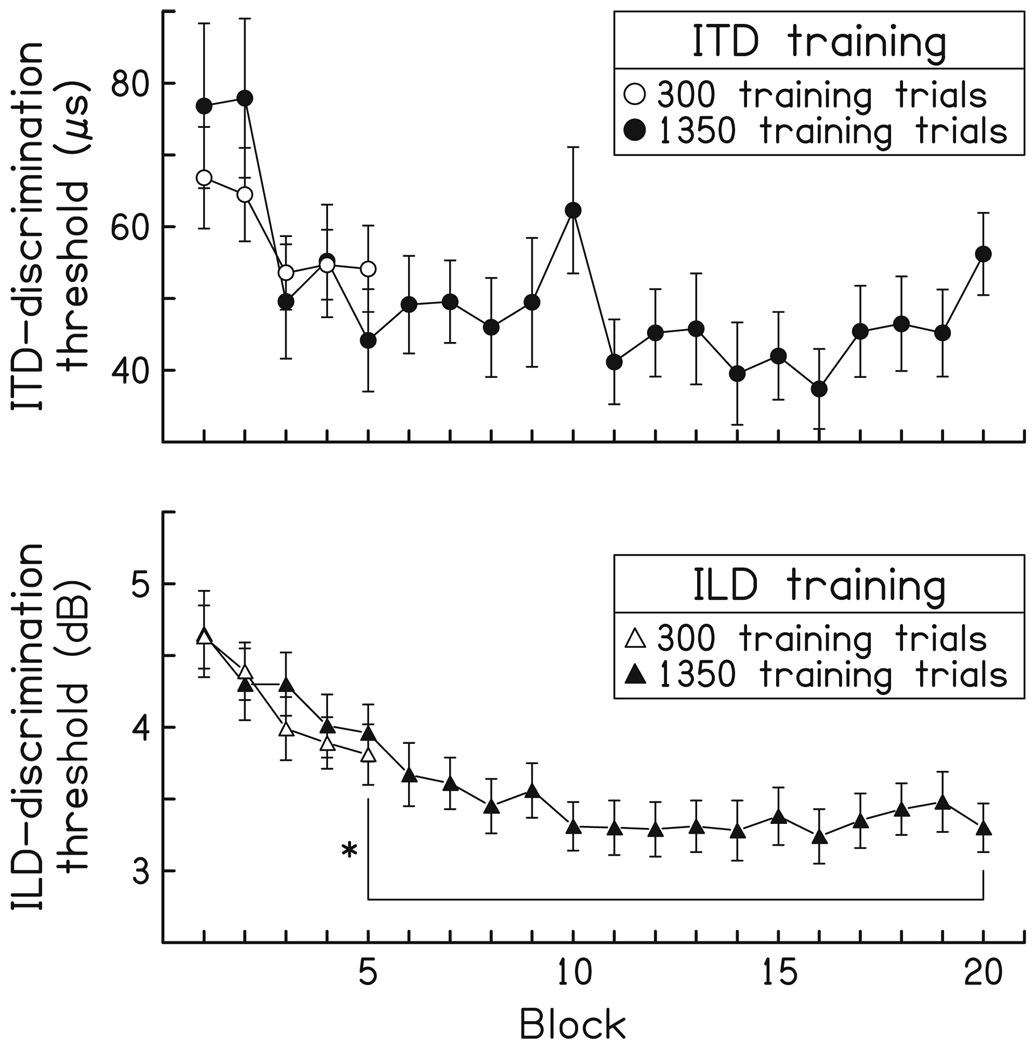
Fig. 6.
Performance during training. Mean thresholds are plotted for each of the five blocks of training from the ITD-trained (top circles) and ILD-trained (bottom triangles) listeners who practiced for 300 trials (open symbols; ITD n = 60; ILD n = 58), as well as for the first 20 blocks (1,200 trials) of training for listeners who practiced for ~1,350 trials (filled symbols; ITD n = 29; ILD n = 48). There is some overlap between the 300 and 1,350 trial ITD data (see “Listeners”). Error bars SEM. * P ≤ 0.05

