Figure 6.
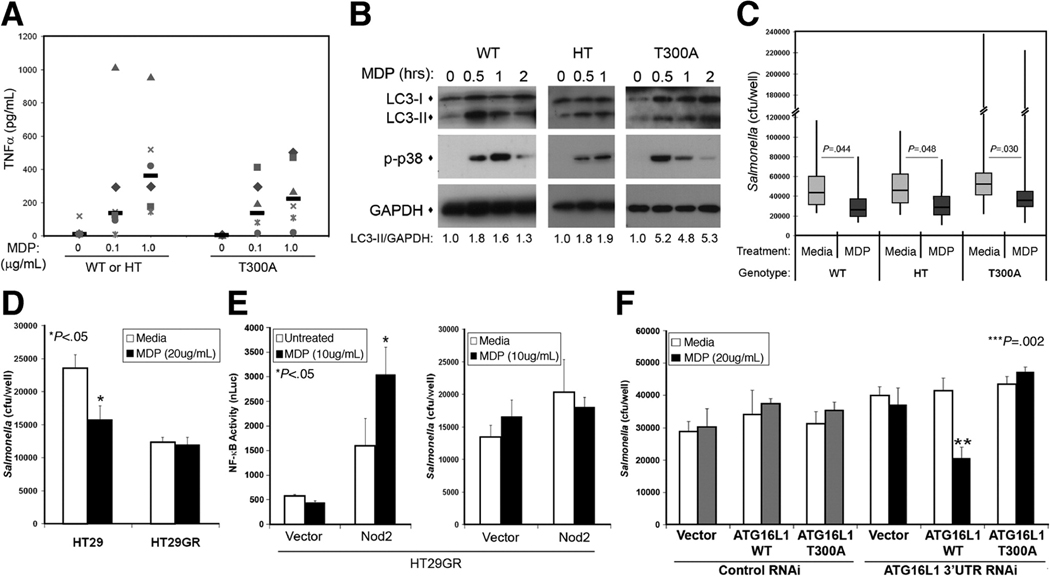
ATG16L1 T300A impairs MDP-enhanced bacterial killing in a cell type specific manner. (A) TNFα secreted by MDP-stimulated PBMCs (0, 0.1 or 1µg/mL for 18h) with the indicated genotypes, median values of the group (n=6) indicated by bars. WT, wild-type ATG16L1; HT, heterozygous ATG16L1; T300A, homozygous ATG16L1 T300A. (B) Immunoblot analysis of MDP-stimulated, (10µg/mL), genotyped, dendritic cells. Autophagy induction quantified by LC3-II accumulation indicated by LC3-II/GAPDH ratio, with similar results seen by alternative quantification of LC3-I/LC3-II ratios. p-p38, phosphorylated p38. (C) Gentamycin protection assay of genotyped macrophages performed in media ± MDP (10µg/mL). Bars indicate the geometric mean values (WT, n=7; HT, n=7; T300A, n=14) with the 95% confidence limits shown by the boxes. The range of response is indicated by the vertical bars. (D) Gentamycin protection assay of HT29 or HT29GR cells performed in media ± MDP (20µg/mL), mean ±SD. (E) NF-κB luciferase reporter assay (left) and gentamycin protection assay (right) in HT29GR cells transfected with vector or Nod2 plasmid and treated with MDP (10µg/mL), mean ±SD. (F) Gentamycin protection assay of Nod2-expressing HT29GR cells transfected with vector, ATG16L1 or ATG16L1 T300A plasmids and control or ATG16L1 RNAi performed in media ± MDP (20µg/mL), mean ±SD.

