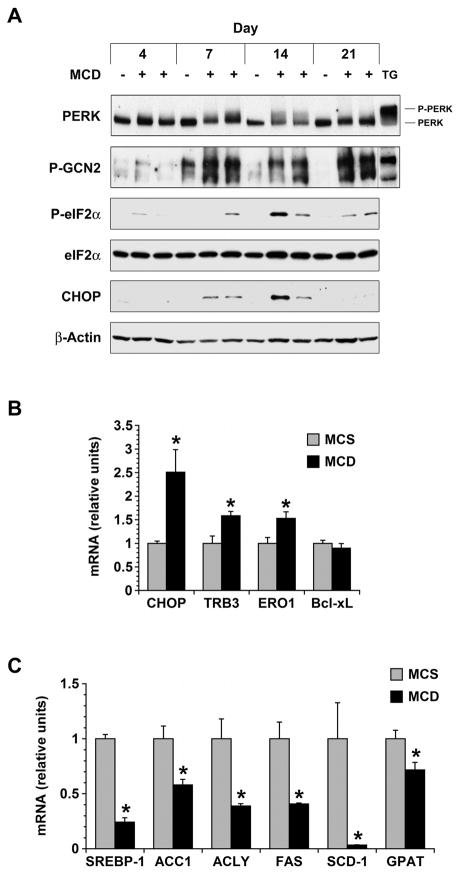
Figure 4. Effect of MCD feeding on molecules involved in the ISR.
(A) The phosphorylation of PERK and GCN2 was monitored in the livers of mice fed MCS (−) or MCD (+) diets for 4–21 days. Thapsigargin treatment (TG) was used as a positive control. The activation of eIF2α and expression of CHOP were also followed over the 21-day interval by Western blotting. (B) mRNA encoding CHOP and its downstream targets TRB3, ERO1 and Bcl-xL were measured by quantitative PCR in the livers of mice fed MCS or MCD formulas for 21 days (n = 5). (C) mRNA encoding several lipogenic genes was measured by quantitative PCR in the livers of mice fed MCS or MCD formulas for 21 days (n = 5). * P < 0.05 vs. MCS.

