Figure 4.
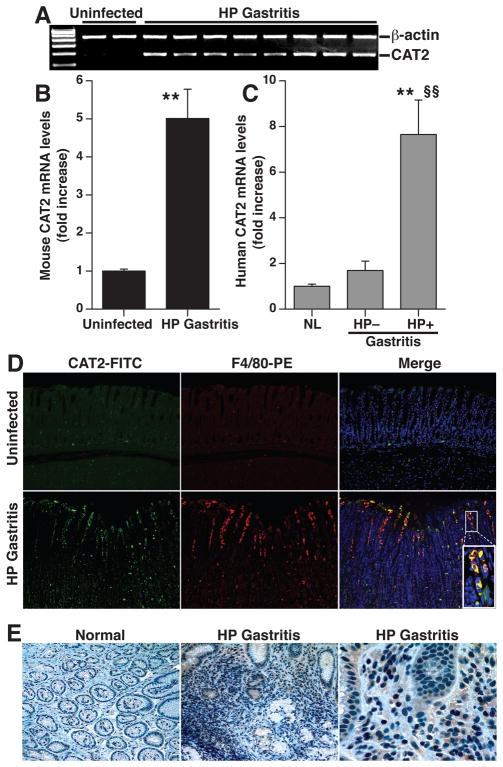
Induction of CAT2 in mouse and human H. pylori gastritis tissues. (A) RT-PCR for CAT2 in mouse tissues from uninfected and H. pylori-infected mice at 4 months post-inoculation. (B) Real-time PCR for CAT2 in mouse tissues, n = 4 control and 9 infected. **P < .01 vs uninfected tissues (C) CAT2 expression by real-time PCR in human tissues from uninfected patients with normal histology (n = 4), H. pylori-negative gastritis (n = 4), and H. pylori-positive gastritis (n = 6). **P < .01 vs normal; §§P < 0.01 vs H. pylori-negative gastritis tissues. (D) Immunofluorescent detection of CAT2 that localizes to macrophages. Mouse tissues were stained for CAT2 detected with FITC (green) and for the macrophage marker F4/80, detected with TRITC (red). Nuclei were stained with DAPI (blue). Co-localization is demonstrated in merged images by yellow color. Magnification for each image is 200X, plus 600X for inset. (E) Immunohistochemistry for CAT2 in human biopsies, magnification is 200X in left and center panels, and 600X in right panel.

