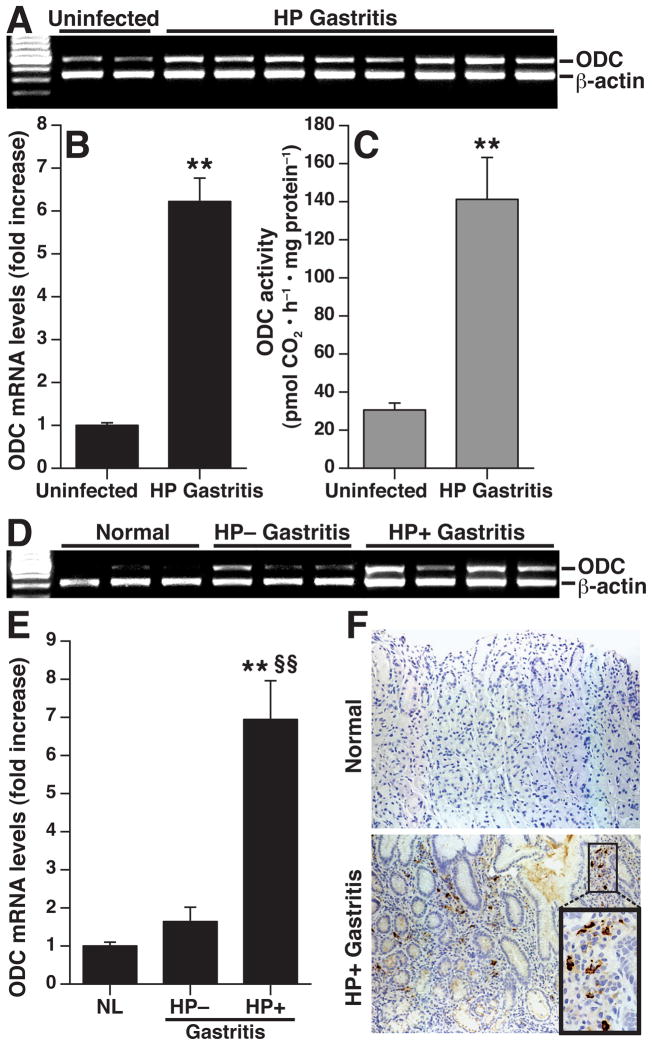
Figure 5.
Induction of ODC in mouse and human H. pylori gastritis tissues. At 4 mo post- inoculation in mice, ODC was assessed by (A) RT-PCR, (B) real-time PCR, and (C) enzyme activity. **P < .01 vs uninfected. n = 4 uninfected and 9 infected in (B), and n = 5 uninfected and 5 infected in (C). In humans, ODC was assessed by (D) RT-PCR, (E) real-time PCR, and (F) immunohistochemistry. In (E), **P < .01 for H. pylori positive gastritis (n = 6) vs uninfected normal tissues (n = 4); §§P < 0.01 vs H. pylori-negative gastritis tissues (n = 4). In (F) magnifications are 200X for both normal and H. pylori-positive gastritis, and 600X in the inset.

