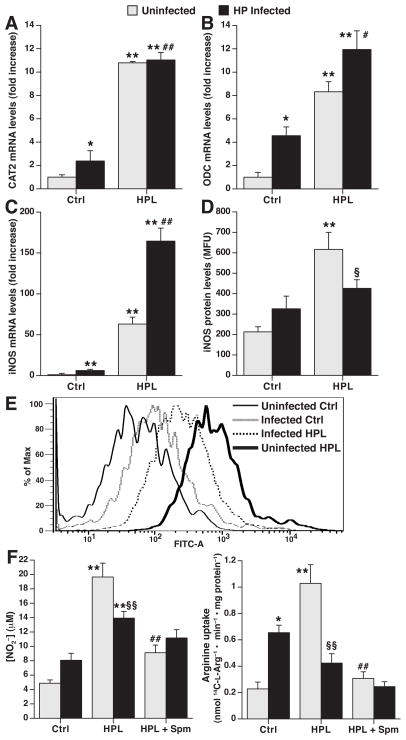
Figure 6.
Deficient iNOS protein expression and NO production in gastric macrophages from H. pylori infected mice. Mice were inoculated with H. pylori or broth control, and after 4 mo gastric macrophages were isolated by positive selection. Cells from both uninfected (light bars) and H. pylori-infected (black bars) mice were then treated ex vivo with vehicle control (Ctrl) or HPL for 24 h. (A–C) Real-time PCR analysis of CAT2, ODC, and iNOS mRNA levels respectively. (D), iNOS protein levels determined by flow cytometry; data are composite results in relative fluorescence units. (E) Representative histogram tracings for the conditions shown in D. In A–D, *P < .05, **P < 0.01 vs unstimulated control cells from uninfected mice; #P < .05, ##P < .01 for HPL-stimulated cells from infected mice vs unstimulated cells from infected mice; §P < .05 for HPL-stimulated cells from infected mice vs HPL-stimulated cells from uninfected mice, n = 6. (F) NO2− levels (left panel) and L-Arg uptake (right panel). Spm (12.5 μM) was added at the start of the ex vivo stimulation. *P < .05, **P < .01 vs unstimulated control cells from uninfected mice; §P < .05, §§P < .01 for HPL-stimulated cells from infected mice vs HPL-stimulated cells from uninfected mice; ##P < .01 for stimulation with HPL + Spm vs HPL only in cells from uninfected mice; n = 6.

